Analytics & Stats
-
IPS5.0.0+
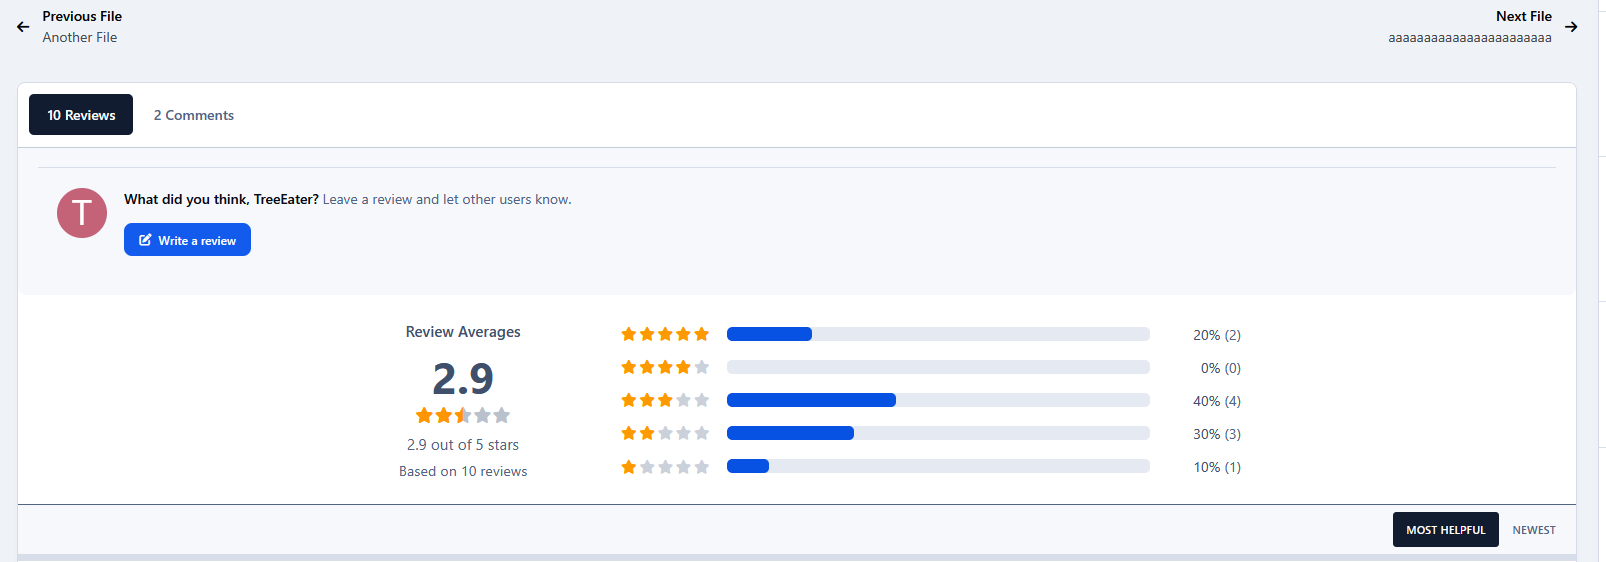
Downloads Review Averages enhances the Downloads file view by displaying a detailed overview of user review ratings. It shows the overall average rating, total number of reviews, rating distribution by star level, percentages, and the number of reviews for each rating, providing a quick and clear summary of user feedback.
Notes:
Requirement: Downloads app
Compatible with both 5-star and 10-star rating systems.
-
IPS5.0.0+
Cohorts & Retention
Invision Community can tell you how many members you have and how many joined last month. It cannot tell you the thing that actually matters: of the people who joined in March, how many were still here in April? In June?
That single question is the difference between a community that is growing and one that is churning while the registration counter goes up.
The grid
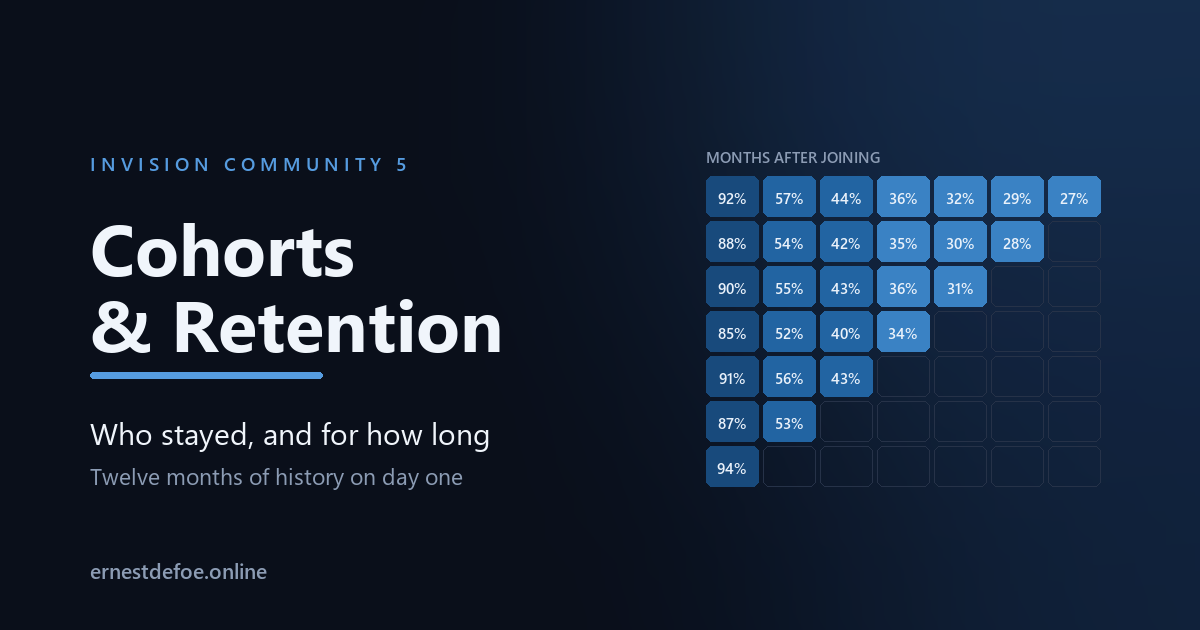
Every row is everyone who joined in one month. Reading across shows how many of them came back one month later, two months later, and so on. Reading down a column shows whether the community is getting better or worse at keeping people — which is the number to watch after you change anything about registration, onboarding or moderation.
Twelve months of history, on the day you install it. This reads data Invision Community has been keeping since your community started, so the grid is complete from the first build. Nothing has to accumulate first.
Two definitions of "still here", because they answer different questions
Signed in
The broad measure. Includes people who read without ever posting, who are the majority of any community. Answers: are they still turning up?
Posted something
The hard measure. Any content in any application — a forum reply, a file, a blog comment. Answers: did they become a participant, or just an audience?
Both are worth looking at, and the gap between them is often the most interesting thing on the screen.
It collects nothing
There is no tracker, no new logging and no external service. Everything comes from three things your community already stores: when each member registered, the record of which days they signed in, and the index of who posted what and when. Uninstalling removes only this application's cached grid.
The grid is built in the background, never while you wait. Building it compares every member against their whole history, so it runs as a background job and stores the result. Opening the screen reads a small cached table — it does not recompute anything.
Honest about what it shows
Periods that have not happened yet are left blank, not shown as zero. A cohort that joined last month has no month-6 figure. Printing 0% there would read as "everybody left" when the truth is "we do not know yet", and that difference matters when you are deciding whether something is wrong.
Month 0 is rarely 100%. It is the month people joined, so anything missing is people who registered and never came back at all — one of the more useful numbers on the grid, and one most analytics never shows you.
Activity dated before somebody joined is discarded. Imported members, merged accounts and hand-edited join dates all produce it. It is dropped rather than shown in a column nobody can interpret.
Small cohorts are noisy. A cohort of nine people moves 11% every time one person returns. The grid shows the underlying counts on hover for exactly this reason.
Also
Weekly or monthly cohorts. Weekly is worth using when you are measuring something specific — a launch, a campaign, a change to registration.
Up to 36 periods across, though twelve is usually where the interesting part has already happened.
No core files are edited. Upgrading Invision Community will not break it.
Requirements
Invision Community 5.0 or newer (self-hosted)
A running task scheduler, to build the grid in the background
Nothing else. No account, no key, no external service.
-
IPS5.0.0+
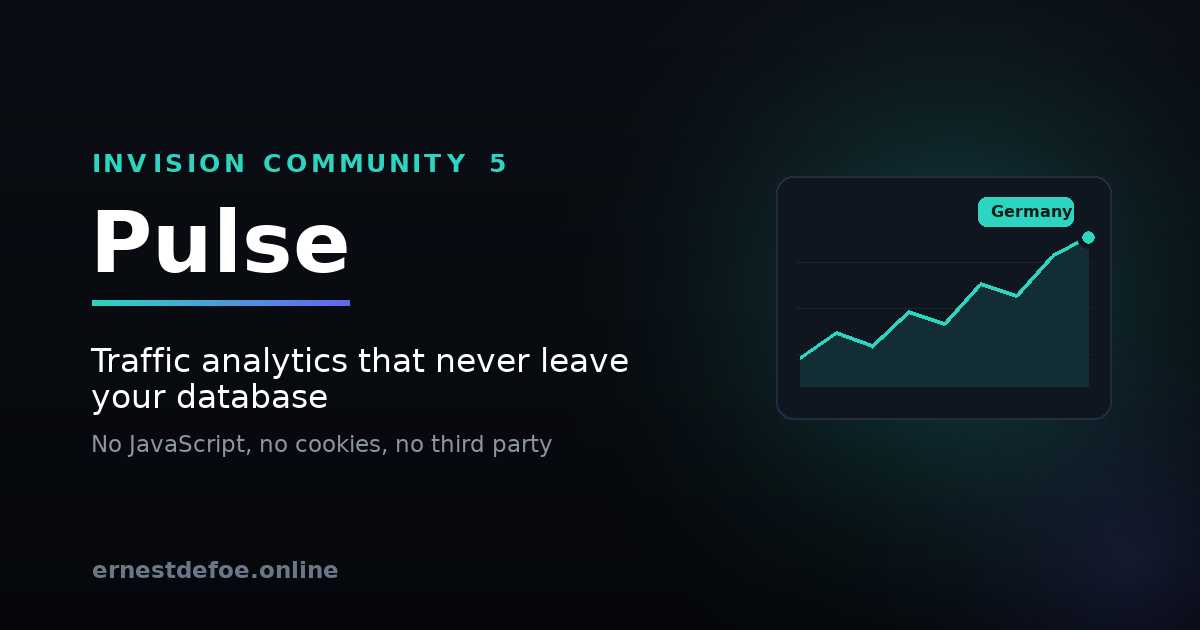
Pulse — traffic analytics that never leave your database
Invision Community tells you a great deal about your content. Registrations, posts, reactions, badges, points, solved rate — there are forty statistics screens in the AdminCP and they are genuinely good.
None of them tell you about your traffic. Not pageviews. Not visitors. Not where anybody came from. Guests, who are most of the people reading your community, appear nowhere at all — they exist only in the sessions table, which is wiped continuously.
The official answer is Google Analytics
Invision Community ships an integration whose entire job is injecting Google's tracking script into your pages. That is the supported route, and for a lot of communities it is not a route at all: a cookie banner, a data-protection question you would rather not answer, and your members' browsing habits handed to an advertising company.
Pulse is the third option. Every figure below is measured on your own server, stored in your own database, and shown in your own AdminCP. Nothing is sent anywhere.
What it measures
Headline
Pageviews · visitors · sessions · bounce rate · average visit length
Where they went
Top pages, with the whole path — not just content items
Where they came from
Referring sites, with your own domain excluded
Who
Members against guests, and desktop against mobile and tablet
Countries
A world map you can hover, country by country
Every headline figure carries a trend line, and the whole dashboard can be read over seven, thirty or ninety days.
No JavaScript. No cookies. No IP addresses.
This matters enough to be specific about, because "privacy-friendly" is easy to claim.
No script is loaded. Not one byte of JavaScript, not even for the charts — the graphs and the world map are inline SVG. Nothing is fetched from anywhere.
No cookie is set, so Pulse adds nothing to a consent banner.
No IP address is ever written to the database. One is read to compute a hash and immediately discarded. There is no column to store it in.
The visitor identifier is salted with a secret that changes every day. It cannot be reversed, and it cannot be matched from one day to the next — so it counts visitors without following anybody.
A pageview records whether somebody was signed in, never which account. There is no member column.
Raw events last hours, not for ever. They are rolled into daily totals and deleted. After that a day exists only as a handful of numbers.
The settings screen lists all of this in the interface, with live counts, so you can answer a data-protection question by pointing at it.
It cannot slow your forum down
The recording happens after the page has already been delivered. Invision Community closes the connection to the browser before running its shutdown work, and Pulse writes its single row at that point. The visitor has their page before the database is touched. There is no query on the way in, no join, and nothing that can fail in a way that affects the page.
Honest about the limits
Some things cannot be measured without JavaScript, and it is better to say so than to invent them:
A one-page visit has no measurable length. There is no exit signal, so bounces contribute nothing to the average visit time rather than a made-up figure. The average is over visits that can actually be measured.
Visitors are counted per day and added up. Somebody who comes on Monday and Tuesday counts twice over a week. Counting them once would mean keeping the raw records for the whole period, which is exactly what this app is designed not to do.
Countries need a header from in front of your site. If you run Cloudflare or a load balancer that provides one, the map fills in. If nothing supplies it, the map is hidden rather than shown empty. Pulse does no geolocation lookups of its own — that would mean either an external request or shipping a database of IP ranges.
Also
Crawlers are separated out, using Invision Community's own spider detection. Search engines can be most of your raw traffic and none of your audience.
You can exclude your own staff, so your browsing does not become the story.
Retention is yours to set — hours of raw events, days of history.
No core files are edited. Upgrading Invision Community will not break it.
Requirements
Invision Community 5.0 or newer (self-hosted)
A running task scheduler — the hourly rollup is what produces every figure
Nothing else. No API key, no account, no external service.
-
IPS5.0.0+
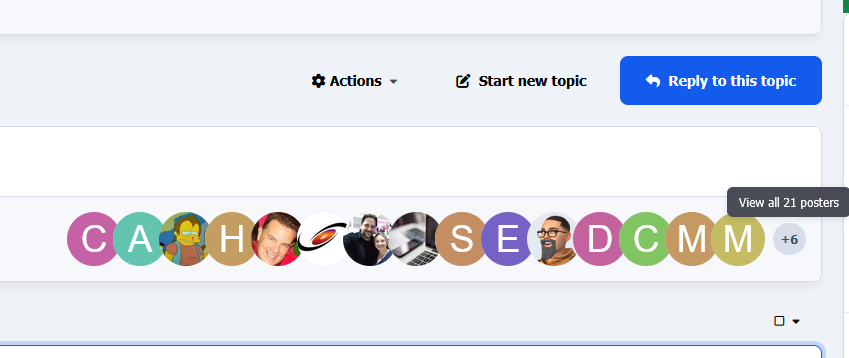
Topic Posters display a clean and modern list of members who participated in a topic. The app adds a new block to the topic view showing member avatars of users who have posted in the discussion, making active participants easier to identify and improving community engagement.
Features:
Display topic posters with member avatars
Randomize displayed members on each page load
Popup with a complete list of all topic posters
Show each member's latest post date in the topic
Configure the number of posters displayed
Choose avatar size
Restrict visibility by member groups
Responsive layout for desktop and mobile devices
A simple way to highlight the people behind each discussion and make your topics feel more active.
-
IPS5.0.0+
It brings member activity, content growth, engagement, reactions, downloads, gallery activity, clubs, tags, Pages databases, warnings and historical forum trends into one polished analytics area, with configurable permissions, profile statistics, widgets and performance-conscious caching.
The concept is based on Adriano’s 4.7x resource, but this version has been written from the ground up for Invision Community 5. It is also inspired by the historical statistics style found in SMF. I asked Adriano for permission before preparing this release, which he kindly agreed to. Without his approval, I would not have released it.
Feature set
Fully responsive layout for desktop, tablet and mobile users
Full community analytics overview with key site statistics
Member analytics, including registrations, activity, top contributors and member lookups
Topic analytics with forum filtering, timeframe controls and member-specific topic stats
Post analytics with post trends, forum filtering and optional topic-based filtering
Reaction analytics, including received and given reaction data
Download analytics for files, views, downloads, reviews and authors
Gallery analytics for images, albums, views and category activity
Club analytics for clubs, members, leaders, invites and growth
Tag and prefix analytics, including support for IPS core tags and compatible prefix data
Warning analytics for moderation activity and warning point trends
Pages database analytics with selectable databases and per-database controls
Forum history dashboard with yearly and monthly rollups
Optional imported historical page-view data from Google Analytics CSV, AWStats CSV or Webalizer CSV
Optional active-time tracking for signed-in members with idle-aware tracking
Profile statistics sidebar block and extended profile Statistics tab
Member privacy controls for profile statistics visibility
Configurable section labels, order, visibility, result limits and call-to-action labels
Group-based permissions for analytics sections and widgets
Guest access controls where suitable
Configurable chart types, including line, area, column, bar and pie charts
Daily, weekly and monthly chart grouping options
Arrow-paged or compact navigation options for analytics sections
Built-in widgets for community snapshots, member snapshots, forum snapshots, content snapshots and reaction snapshots
Widgets for most content, most reputation, latest members, most posts, latest posts, most topics, most replied topics and most viewed topics
Additional widgets for clubs, downloads, gallery, reactions and warnings where the relevant apps/data are available
Total downloads widget for Downloads-powered communities
Cached analytics refresh task for better performance on active communities
ACP diagnostics, cache refresh tools and historical rebuild tools
Optional third-party analytics sections for supported apps such as Videos, Books, Routes, Movies and Links
Front end path
Domain > Analytics
ACP path
ACP > Statistics > Community Analytics
-
IPS5.0.0+
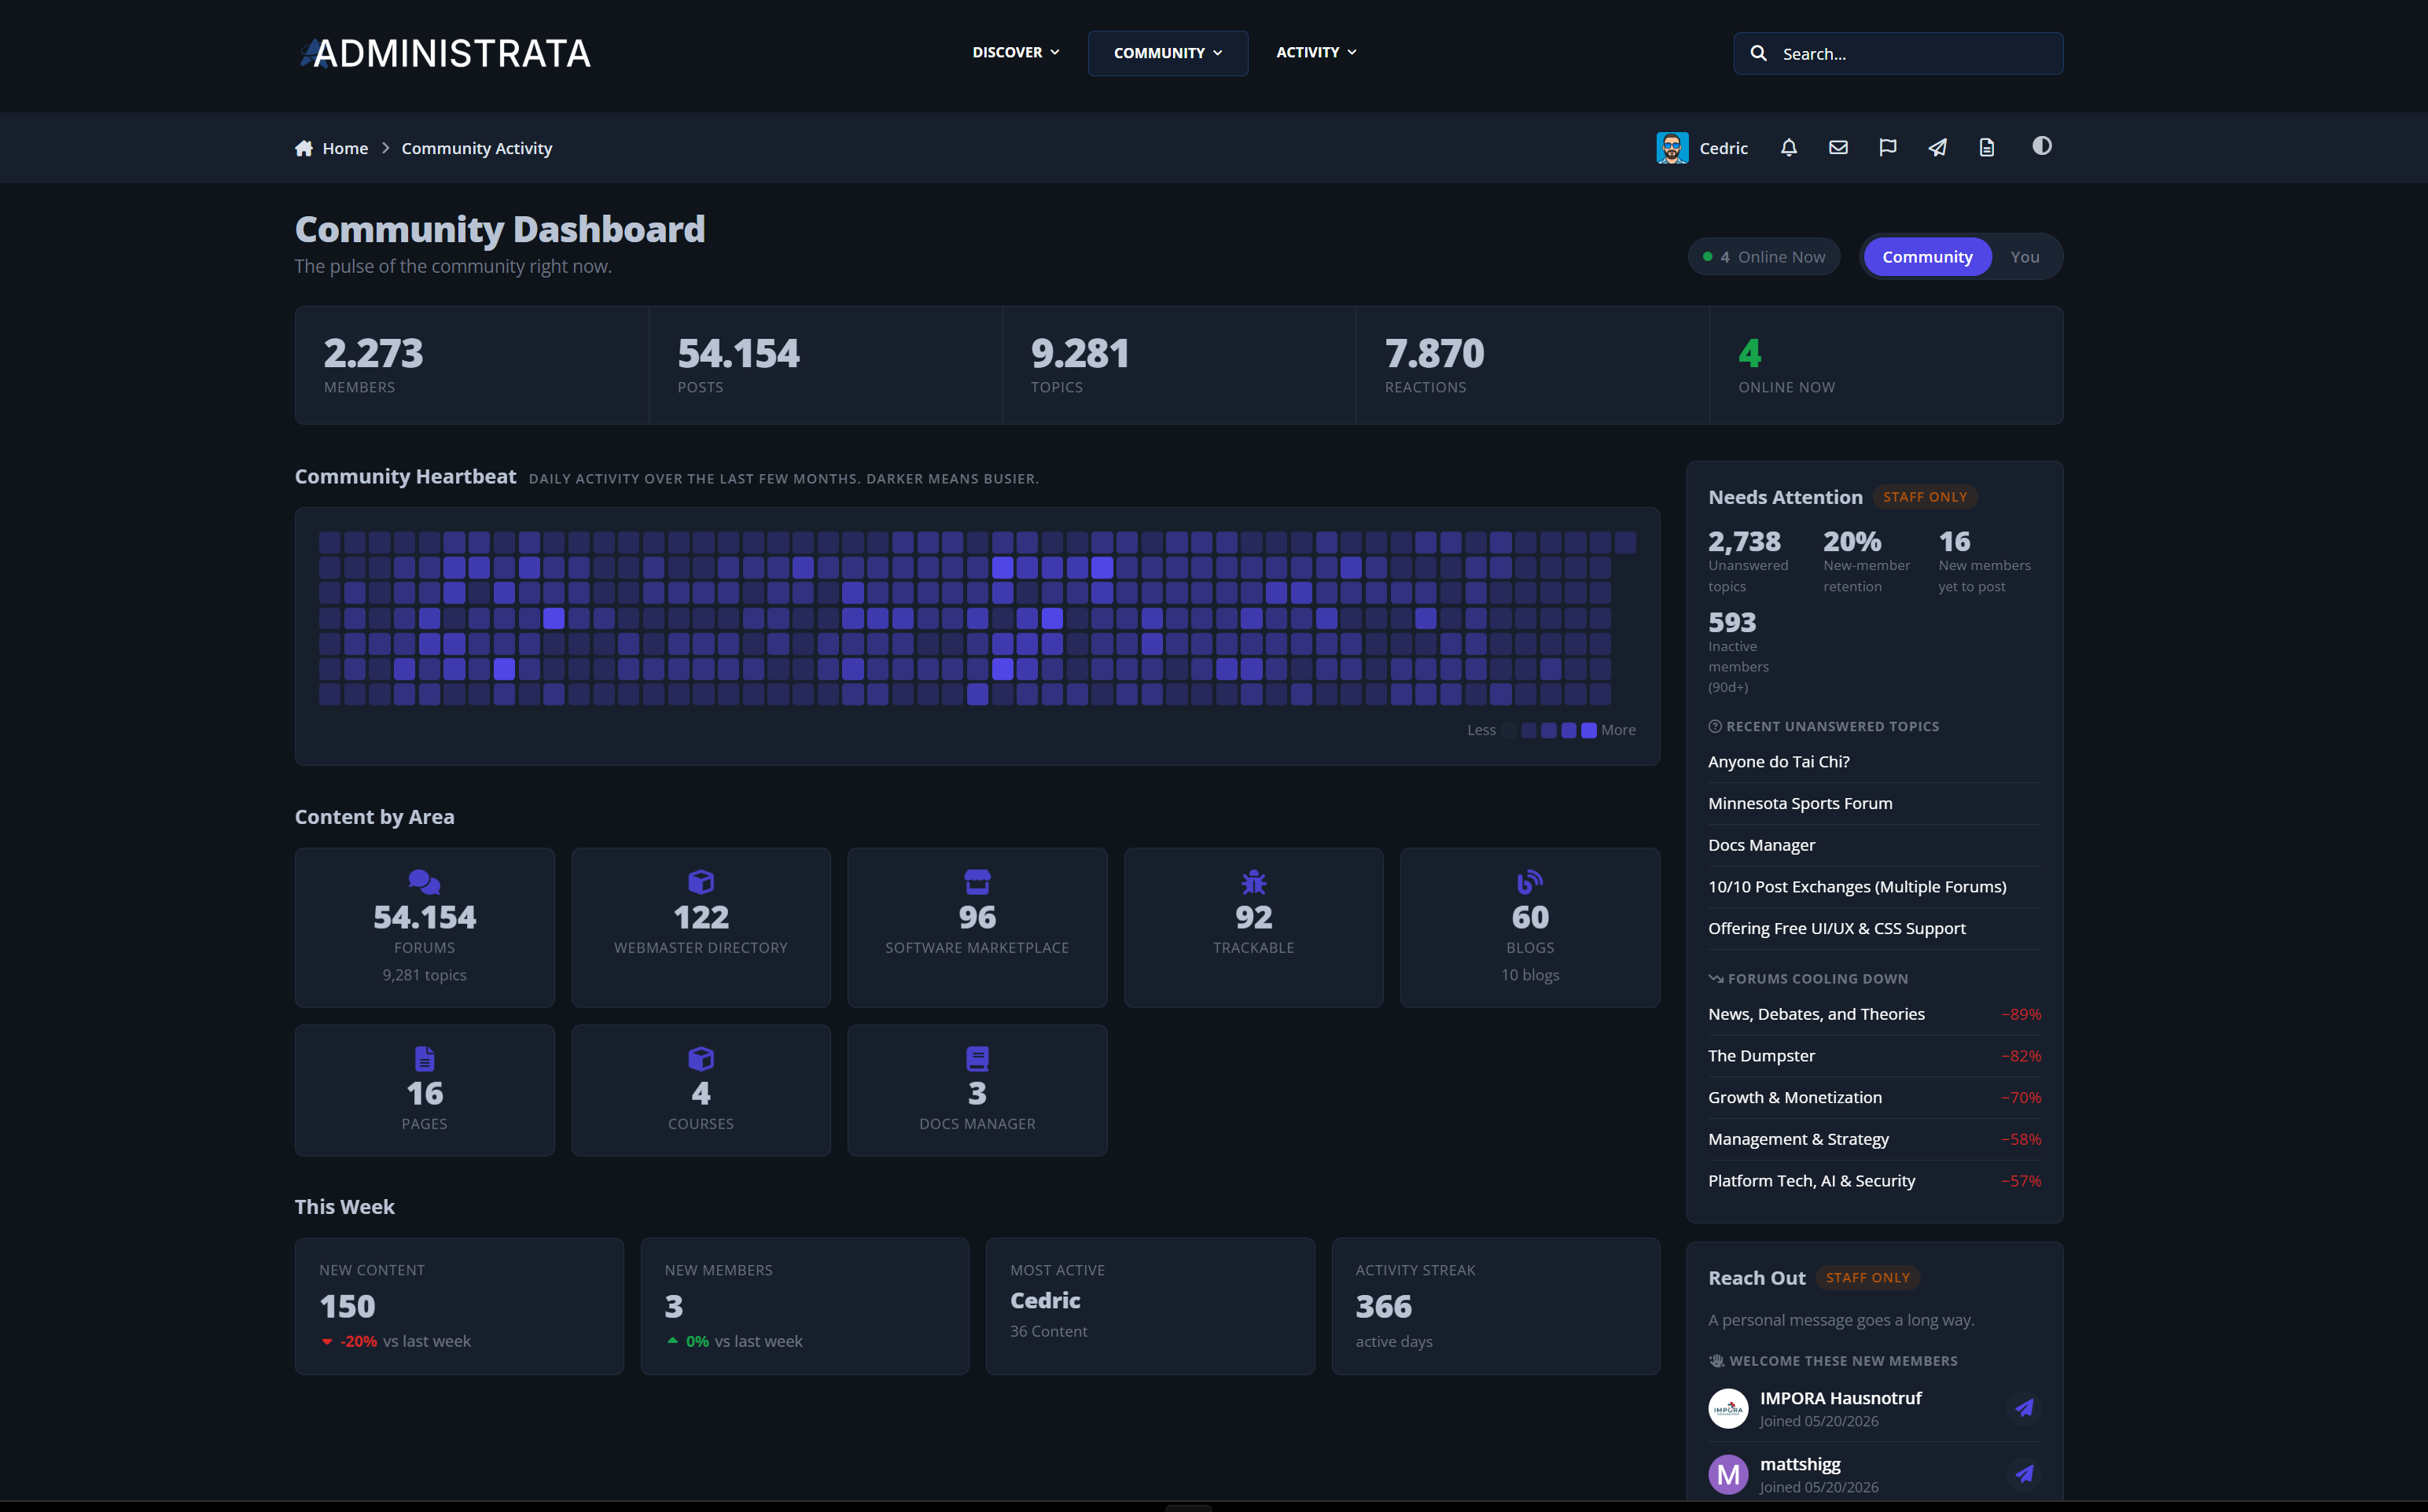
Community Activity is a front-end statistics and engagement dashboard for Invision Community Suite v5. It turns the data your community already produces into a polished, public-facing experience: growth trends, a year-long contribution heatmap, top members and content, cross-application breakdowns, personal scorecards, staff-only outreach tools, and automatic engagement notifications. It complements the built-in board statistics instead of replacing them, and it looks like a native part of your community from the first page load.
Live demo: Community Activity
A Real Dashboard, Not a Buried Stats Page
A polished single-page dashboard at a clean URL: /community-activity/
Live headline totals: members, content, reactions, and who is online right now
A full-year contribution Heartbeat, similar to a contribution graph, so momentum is visible at a glance
Sections animate in as you scroll, without slowing the page down
Light and dark mode aware, fully responsive, and motion-reduced for accessibility
Your statistics stop being an admin afterthought and become a destination.
Community Insights at Every Angle
Growth Trends: a multi-line chart of content, members, active members, and reactions, with instant 7, 30, 90, and 365 day range switching
Activity Patterns: when your community is most active by hour of day
Community Mood: how members react, with a positive, neutral, and negative sentiment split
Content Mix: what is being created across your community month by month
Content by Area: a breakdown across Forums, Gallery, Downloads, Blogs, and more
Top Members, Top Topics, and Busiest Forums: quick views of what and who is driving activity
Records and Milestones: all-time high-water marks plus a celebratory Year in Review
Everything is permission-aware, so members only see content they are allowed to see.
A Personal Scorecard for Every Member
The You tab turns participation into something members care about:
"You are more active than X percent of members"
Personal milestone badges: first topic, ten replies, one hundred posts, best answer, and one-year anniversary
A friendly engagement level, from Quiet Reader up to Community Driver
Your rank this week, posts this month, most-viewed topic, most-reacted content, and your contribution breakdown
Every member gets a reason to come back and watch their numbers climb.
Smart Staff Tools That Drive Retention
When a moderator or admin opens the dashboard, a staff-only sidebar appears with practical, one-click actions:
Needs Attention: unanswered topics, retention signals, first posts with no reply, and cooling-down forums
Reach Out: welcome new members, win back quiet ones, catch power members who are slipping away, and congratulate anniversaries, each with a quick message action
Spotlight: rising stars and members who are one or two posts away from a milestone
Spot the people who need a nudge before you lose them, and recognize the ones carrying your community.
Automatic Engagement Notifications
Six built-in notification types keep members coming back:
Post of the week, personal milestones, activity streaks, weekly recap, ranking updates, and community milestones
Never about the past. Installing the app records the current state silently and only notifies on new activity, so nobody gets flooded with alerts about old events
You choose which types are sent community-wide
Members stay in control and can opt out of any type
They carry your site favicon, so they clearly feel like part of your community
Automated encouragement that never feels spammy.
Built to Be Fast and Self-Sufficient
Aggregate-first design with a daily background task, so the dashboard stays instant even on busy communities
A bundled charting library served locally, with no external dependencies
Builds up to a year of history automatically, so the Heartbeat and Growth charts have data immediately
A front-end widget with two layouts, sidebar and horizontal, for any block area
Native AdminCP settings, group-based access control, and an in-panel support page
No external services, no tracking, and no new personal data collected. It reads what Invision already stores.
Perfect For
Communities that want members to feel their own progress
Forums looking to boost retention and repeat visits
Staff teams who want actionable health signals at a glance
Any community that wants its statistics to feel like part of the site
Community Activity gives your community a living dashboard that members enjoy, staff rely on, and that runs itself. Take a look at the demo and see it in action.
-
IPS5.0.0+
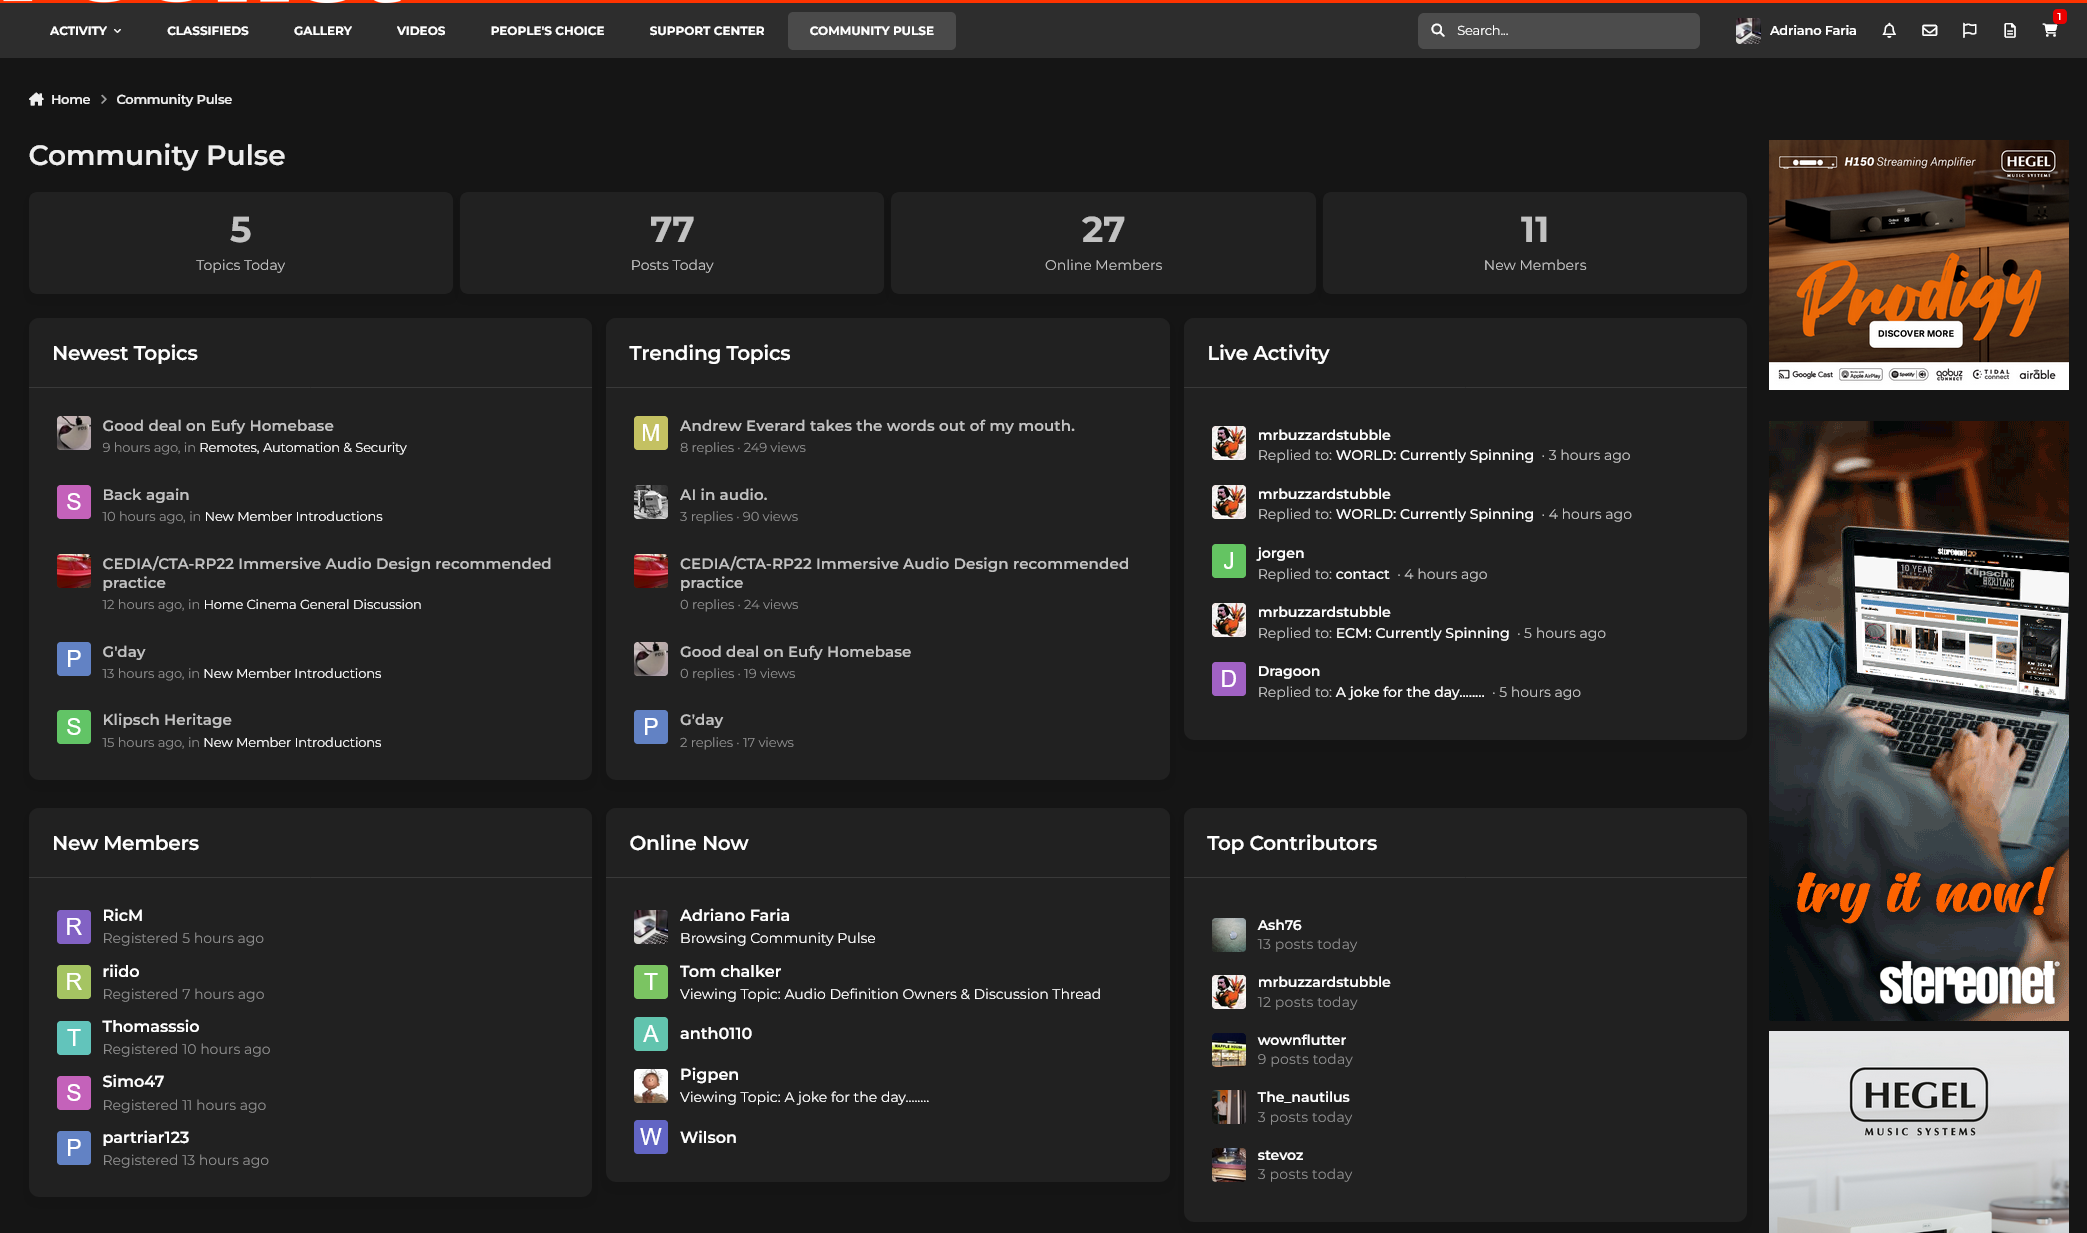
Community Pulse delivers a real-time activity dashboard showing what’s happening across your site right now — from new topics and trending discussions to live activity and the current locations of online members.
It updates instantly via AJAX and highlights changes as they happen, creating a truly "alive" feeling for your community.
Includes:
Real-time activity updates
Trending & newest topics
Live activity feed
Online users with a location
Top contributors & new members
Configurable limits and exclusions
Make your community feel active. Make it feel alive.
-
IPS5.0.0+
Features:
DISPLAY STATS IN TAB VIEW
DISPLAY STATS IN GRID VIEW
Manage stats in widget's settings:
Easy to add/delete stats.
Drag & drop to reorder the position quickly.
Clicking on stats to options: title, categories, thumbnails.
Supports IPS official apps: Forums, Downloads, Pages, Nexus, Gallery, Calendar. And 3rd party apps that meets the requirement for IPS4 Content, such as: Videobox, Musicbox, Tutorials, etc.... with the following stats:
New content
New comments
New reviews
Most viewed
Hot Topics
New Members
Top Reputations
.....
Other:
Auto-update stats every X seconds.
Widget title.
Thumbnail style (square or round).
Fully support AJAX.
Fully support responsive design.
https://www.youtube.com/watch?v=JEW2Lpp1t8g
-
IPS5.0.0+
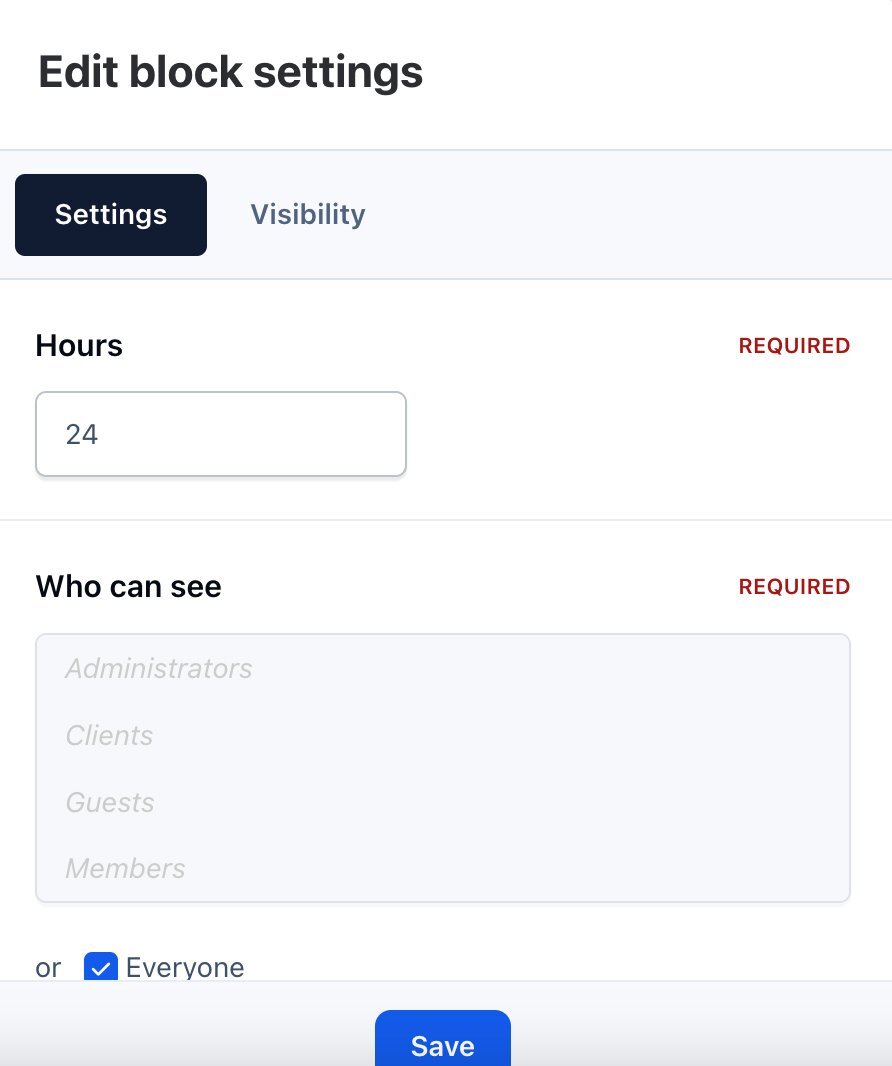
Who was online - widget that adds statistics of users who have been online for the last X hours.